
HOW A PLACE MAKING DESIGN CONTRIBUTES TO NET ZERO CARBON EMISSIONS
As we all know climate crises and carbon emissions are the biggest global challenges. In my capacity as an architect and upcoming urban designer, I would like to propose how Placemaking design strategies can help in achieving net zero carbon emissions, thus contributing to sustainable community development.
Potential interventions in achieving net zero carbon emissions:
-
Spatial Transportation planning
The largest emitting sector in the UK, transportation accounted for 24% of all emissions in 2020. Cars and taxis were the main causes of this. (Transport and environment statistics 2022, UK). Interventions like substituting trips, shift modes, and switching fuels can be implemented in transportation planning. (Net zero transport by RTPI, January 2022)
- Substituting trips: Active travel infrastructure should be designed in such a way that people forcefully use them as a daily practice. Designing good network connectivity for cycling and walking. All home deliveries might be planned with flexible pickup and delivery locations. IT infrastructures may contribute by implementing a work-from-home policy with lightning-fast Wi-Fi to cut down on employee use of personal vehicles.
- Shift modes- Shared mobile schemes such as eBike share, car share clubs, and mobility hubs could be implemented. Public transportation should be made demand responsive. By reducing car parking, street spaces should be actively used for walking and cycling.
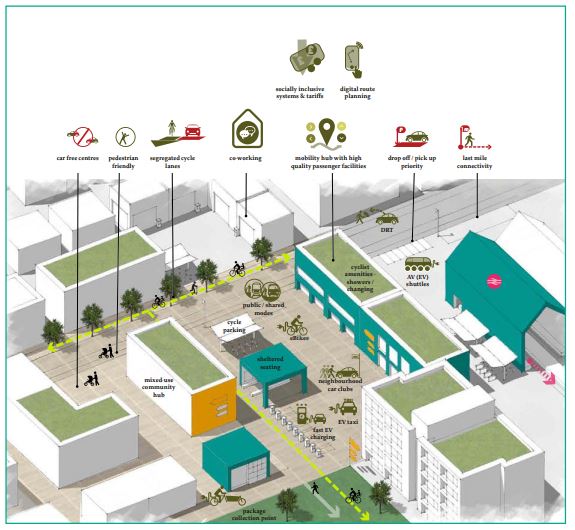
FIGURE 1: A typical mobility hub in a city/ neighbourhood centre - Switching fuels- Electric vehicles are becoming more popular these days. Urban design should include EV (electric vehicle) charging stations and a hub. Facilities for charging hydrogen fuel cells should also be taken into account in addition to EVs. (Net zero transport by RTPI, January 2022)
-
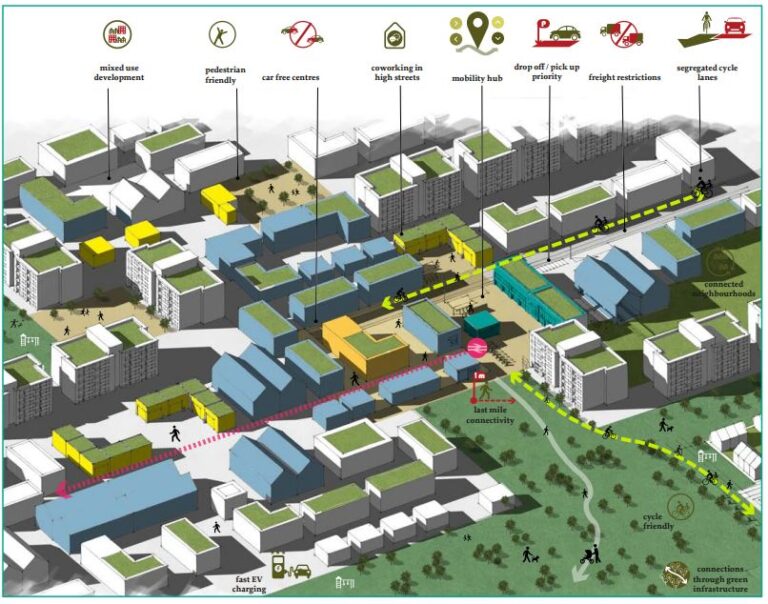
Neighbourhood design and mobility hubs
Neighbourhoods should be designed to ensure that public services are accessible to residents within the neighbourhood zone to minimize their travel. It is important to build new multipurpose areas that attract people to live, work, and play there. A resilient design that can keep up with the rapid changes in public services and climate should be considered. A neighbourhood center with a functional mobility hub should be accessible from its outskirts in 15 minutes on foot. Also, a neighbourhood should be located at a reasonable distance from the city’s core.
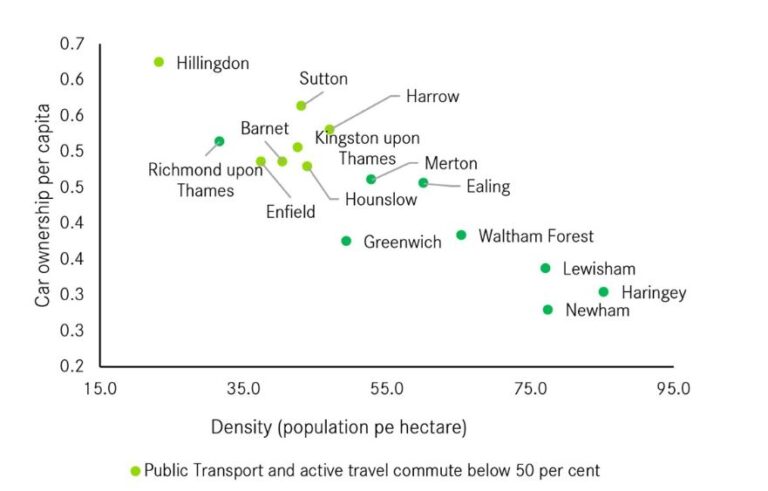
London serves as evidence of how neighbourhoods near urban centres have lower carbon footprints. Low amounts of carbon emissions are seen in London neighbourhoods like Islington and Hackney Borough, which are relatively denser and closer to the city centre ( Below 0.5 tonnes of CO2 per year) . While Havering and Hillington, two other London neighbourhoods, have 3 to 4 times as much emissions as the first. The carbon footprint of households is also influenced by urban density. The higher the density of a neighbourhood, the higher the demand for public transit, which reduces carbon emissions. (centreforcities.org)
Therefore, the aforementioned strategies like technological advancements , the use of electric vehicles, clear disincentives to driving ( clean air zones and workplace car levies) as well as community participation in designing neighbourhoods could contribute in solving all the problems.
Bibliography:
Transport and environment statistics 2022, UK – https://www.gov.uk/government/statistics/transport-and-environment-statistics-2022/transport-and-environment-statistics-2022
Net zero transport by the RTPI, January 2022- https://www.rtpi.org.uk/media/9233/rtpi-net-zero-transport-january-2021.pdf
centreforcities.org- https://www.centreforcities.org/blog/how-urban-planning-is-key-to-net-zero/
Figure 1- A typical mobility hub in a city/ neighbourhood centre- Net zero transport by the RTPI, January 2022- pg 22
Figure 2- A neighbourhood design by RTPI- Net zero transport by the RTPI, January 2022- pg 20
Figure 3- Statistics showing denser areas reducing the need of having a car- Source: DfT, 2020; ONS, Census 2011.